This form will search for words in the title OR the description. If you would like to search for the same term(s) across both the title and description, enter the same search term(s) in both fields.
This form will search for any of the words you enter in a field, not the exact phrase you enter. If you would like to search for an exact phrase, put double quotes (") around the phrase. For example, if you search for Bike Path you will get results containing either the word BikeOR the word Path, but if you search for "Bike Path" you will get results containing the exact phrase Bike Path.
The Energy Team had their meeting on Tuesday, Oct. 8th, from 3:30 - 4:30 PM. We discussed solar rooftop project progress, reviewed funding opportunities for sustainability projects, and explored improvements to campus energy dashboards. Other topics included state-mandated LED transitions and occupant comfort strategies in campus buildings. The meeting minutes are attached!
Our next meeting is November 12th, 3:30 - 4:30 PM.
Please see the included link to the live dashboard of the Energy Farms Agrivoltaic Solar Array. This link also includes data for the Geothermal and traditional HVAC at the farm.
Currently, 70 of the first 80 building dashboards are complete, which represents 92% of the University's energy consumption. Many of the dashboards are visible on building video displays for all building occupants to view. They continue to vet the data streams and will add more dashboards as they continue our efforts in the future. We contract Hawkeye Energy Solutions to develop and maintain the dashboards.
Any thing you can share is helpful and happy to jump on a call if that’s faster.
Thanks for your help.
Andy Mitchell
--------------------------
Rob,
Colleagues at UIC are interested in UIUC’s Energy Dashboard Project. However, the information on the dashboard stops at FY14 and the links to the building-level information are broken. I see a lot of value in this project for campus. Is there any way to reinvigorate the project and update the content?
Let me know if there is something iSEE can do to help.
Thank you,
Jennifer
---------------------------
Hello Jennifer,
Thanks for reaching out to UES on this topic. I am glad to hear that people have an interest in the UIUC energy dashboards. Our team has done a great job on this initiative, and we are leading the efforts amongst our peers. In fact, UIUC and vendor staff will be presenting this topic at the International District Energy Association Campus Energy Conference this February. We am quite proud of the success we have achieved in this area.
In reference to the UIC system, I actually had worked on developing energy dashboards at UIC when I was the Director of UES there. We had some success, but the product was a bit difficult to maintain. I believe that support for those UIC dashboards has ended.
After receiving your email, I reached out to the Engineering/Consultant firm that I worked with to develop dashboards for both UIC and UIUC. Aaron Mason from Hawkeye Energy Solutions (Shorewood, IL) informed me that the platform that they are using at UIUC is a “much better, lightweight, and responsive” then the solution that was originally used at UIC. The underlying data streams at both campuses are similar, so the development of dashboards for UIC should be relatively easy.
Regarding the link that was provided for the UIUC dashboards; that link is actually an old link that is no longer supported. Please use this link to view the new dashboards at UIUC: http://uesdash.fs.illinois.edu/ . This system does not require a login, and is easy to navigate. We currently have 70 of the first 80 building dashboards completed, which represents 92% of the University energy consumption. Many of the dashboards are visible at building video displays for all building occupants to view. We continue to vet the data streams and will add more dashboards as we continue our efforts into the future.
To help you and Andy resolve any questions, I am including the following people on the cc so that you can reach out to them directly if it helps you in your efforts.
Cedric Everett – Assistant Director of Utilities and Energy Services at UIC (Can help you navigate the energy data at UIC, as well as contracting with Hawkeye Energy Solutions).
Aaron Mason – Director of Operations, Hawkeye Energy Solutions (Can assist with the technical background of a dashboard solution).
Robbie Bauer – Management Engineer Utilities Distribution UIUC (Is the lead engineer at UIUC for development and implementation of energy dashboards).
Hopefully this answers your questions. If not, please don’t hesitate to contact me for more information. We welcome the opportunity to work together.
Thanks, Rob
--------------------------------
Hi Rob,
Thanks so much for this information and for reaching out to your colleague at Hawkeye Energy Solutions. I’m pleased to see that this project is going strong!
If it’s ok with you, I would like to update the iCAP portal with this information, especially the URL for the new dashboards.
Andy, if there is anything else we can help with, please let use know.
The Illini Energy Dashboard provides clearly visible understandable information data and information to students and staff of selected University buildings describing energy consumption rate (electrical, chilled water and steam) so that users can make educated choices about the way they can affect energy consumption and conservation. The biggest challenge in successfully creating a campus-wide goal of energy reduction is being able to evoke a behavioral change resulting in energy conservation and sustainability efforts. This project aims to achieve such a change by showing energy consumers at the University how they're consuming energy in a clear way.
The Energy Dashboard Project is a multi-part project that includes implementation of a website, connection of existing real-time energy meters, and installations of additional real-time energy meters throughout campus. With support from the Student Sustainability Committee, this project funded the purchase of the website module for the campus' energy data historian program, through Insight. F&S staff oversaw the implementation of the module, and ECI staff developed the look and reference content of the site. The website went live in early 2012, and existing real-time meters have been connected. At this time, additional metering is underway.
Project Background
The conversion factors used in the dashboard display are:
Average US Household: 901 kWh/month, 30.03 kWh/day
The Energy iCAP team met at 9:00 A.M. on Wednesday, January 26th and discussed updates on recommendation ideas as well as agreed to move forward with the submission of two recommendations to the iCAP Working Group. Progress is currently being made on a feasibility study of CO2 District Heating and Cooling which will be undertaken by a group of engineering students during the Spring Semester, and progress on a new recommendation for Building Envelope Commissioning will take place.
The Team also agreed to move forward with a recommendation that the Office of the Chancellor commission a report on the Safety and Security of a proposed MMR Nuclear Reactor on campus property as well as another recommendation that would seek to charge Facilities & Services with developing a comprehensive energy plan that will bring the University to net-zero emissions by 2050.
Further Details on the meeting can be found in the attached agenda which also contains meeting minutes.
“In summary, there will be 2 slides taking turns to be displayed on the digital screen in CIF. The first slide is primarily composed of the 3D GSHP system schematic (Ground loops, heat pump and building) and the key parameters & features. The second slide shows the results from building energy modeling, including annual outdoor temperature variations, heating/cooing loads and other energy consumptions. This may [help] visualize the impact of CIF geothermal and give public a better understanding on the renewable resources.”
-John Zhao (11/14/2022)
PhD. Candidate
Research Assistant
Agricultural & Biological Engineering
Research field: Ground Source HVAC System/Subsurface Heat Transfer
The Energy iCAP team combined its November and December meetings for the fall of 2021 into a single "Winter Meeting" This meeting was used to discuss 12 different recommendation ideas, a select amount of which will be developed into recommendations in the near future.
Additionally, the team discussed a short note to the iCAP Working Group asking that the Comprehensive Energy Plan not have its name changed to '"lean Energy Plan"
After discussions with Michael McKelvey at MSTE and Aaron Mason and Ian Bonadeo at Hawkeye Energy Solutions, since Morgan White put them in contact back in April, the ECE building’s energy dashboards are now available without requiring a login and via domain name rather than IP address! Here are the dashboards:
Joyce Mast is working with Patricia Franke to refine the ECE energy displays to include the effect of local weather on the solar panels. F&S Utilities and Energy Services is connecting Joyce with the contact people at Hawkeye Energy Solutions, who incorporated real-time energy data in the ECE energy dashboard, using campus data provided by F&S.
From: McKelvey, Michael L Sent: Tuesday, July 13, 2021 10:10 AM To: White, Morgan Subject: ECE building energy dashboards
Hi Morgan,
You may already be aware of this, but I wanted to let you know that, after corresponding with Aaron Mason and Ian Bonadeo at Hawkeye Energy Solutions since you put us in contact back in April, the ECE building’s energy dashboards are now available without requiring a login and via domain name rather than IP address! Here are the dashboards:
During a conversation between U of I staff across multiple departments, the following resources were compiled to brainstorm content for the display and kiosks in the ECE lobby:
Joyce Mast met with MSTE and F&S contacts today to brainstorm ideas for energy and atmospheric data to be displayed in the ECE lobby on the digital touch screen.
Objectively, everyone knows you should conserve energy resources, but it is easy to lose track of that goal in the hundreds of other things our brains need to think about each day. One way to encourage people to be more cognizant is to give them a tangible reminder. The local electric company, for example, sometimes send a reminder notice that tells you how well you’re doing with energy consumption compared to other homes the size of yours in the area. In a similar idea, F&S has developed an improved energy dashboard that will be used in campus facilities. Beginning with the Electrical & Computer Engineering (ECE) Building, Energy Dashboards will be deployed to show the utility use for a specific building. It will also show if that use is above or below average for the last 30 days or one year. The dashboard appears in the rotation of the ECE digital signage in the lobby of the building. The plan is to expand it to other buildings to help promote energy awareness and conservation on campus.
As of March 01, 2021, many small edits and content ideas were suggested for ECEB-related project pages on the iCAP Portal. These suggestions to update the pages were provided by Joyce Mast and include the following:
The North Campus Parking Solar Project was canceled.
The ECE department was looking to buy Solar Farm 2.0 Renewable Energy Credits (RECs) from F&S to try and achieve net 0 emissions.
They are working to secure grant money for a monitor inside the ECEB where students can interact with their current progress. I attached more information about it.
On February 28, 2021, Catherine Somers sent out an email to Professors Bruce Hajek and Philip Krein regarding the ECE lobby displays. As written in the exciting email:
"I have a bit of good news! The Student Sustainability Committee-funded lobby display which will eventually have interactive features to encourage energy savings, is taking shape. The kiosks and the touchscreen panel are installed and rotating informational slides. Joyce Mast continues to make excellent progress on the real-time display of solar energy production." -Catherine Somers
This approval follows suit after the Mast's submitted application for SSC funding for the lobby displays. In Step 2 of the funding application, $30,000 was requested from the SSC for "Electrical and Computer Engineering Building (ECEB) Interactive, Energy Education/Production/Use Display."
See the attached file to view the SSC funding application.
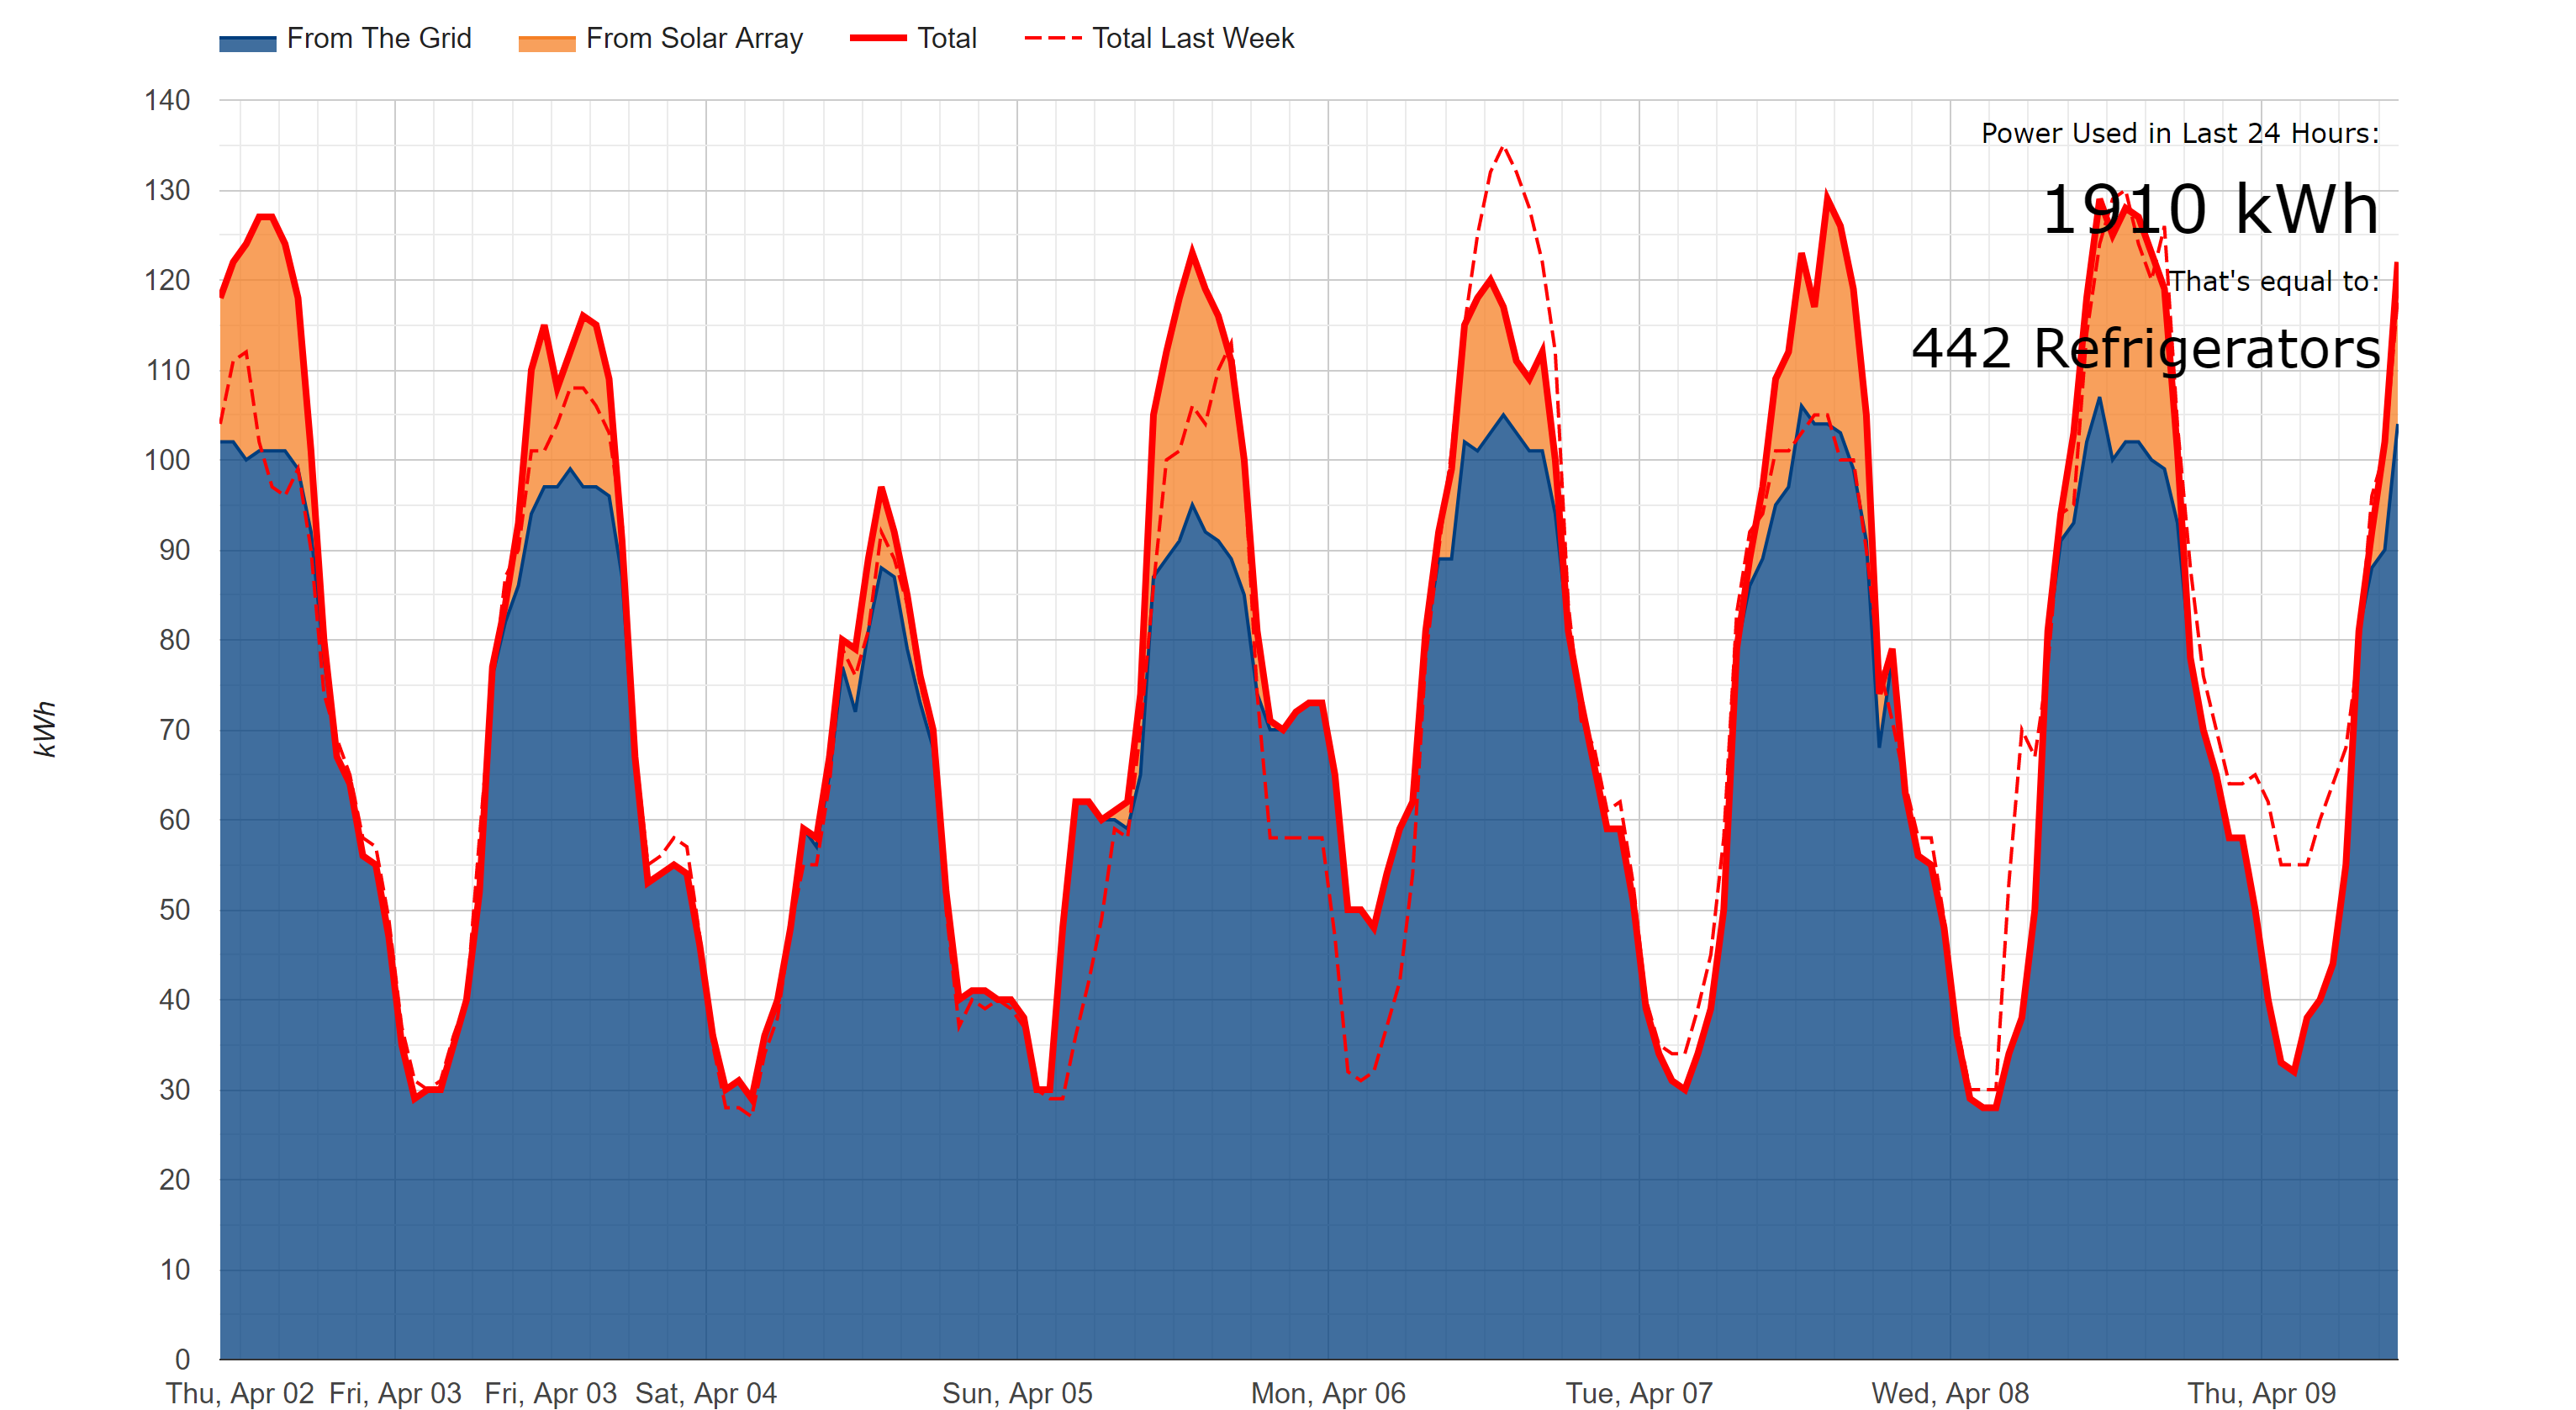
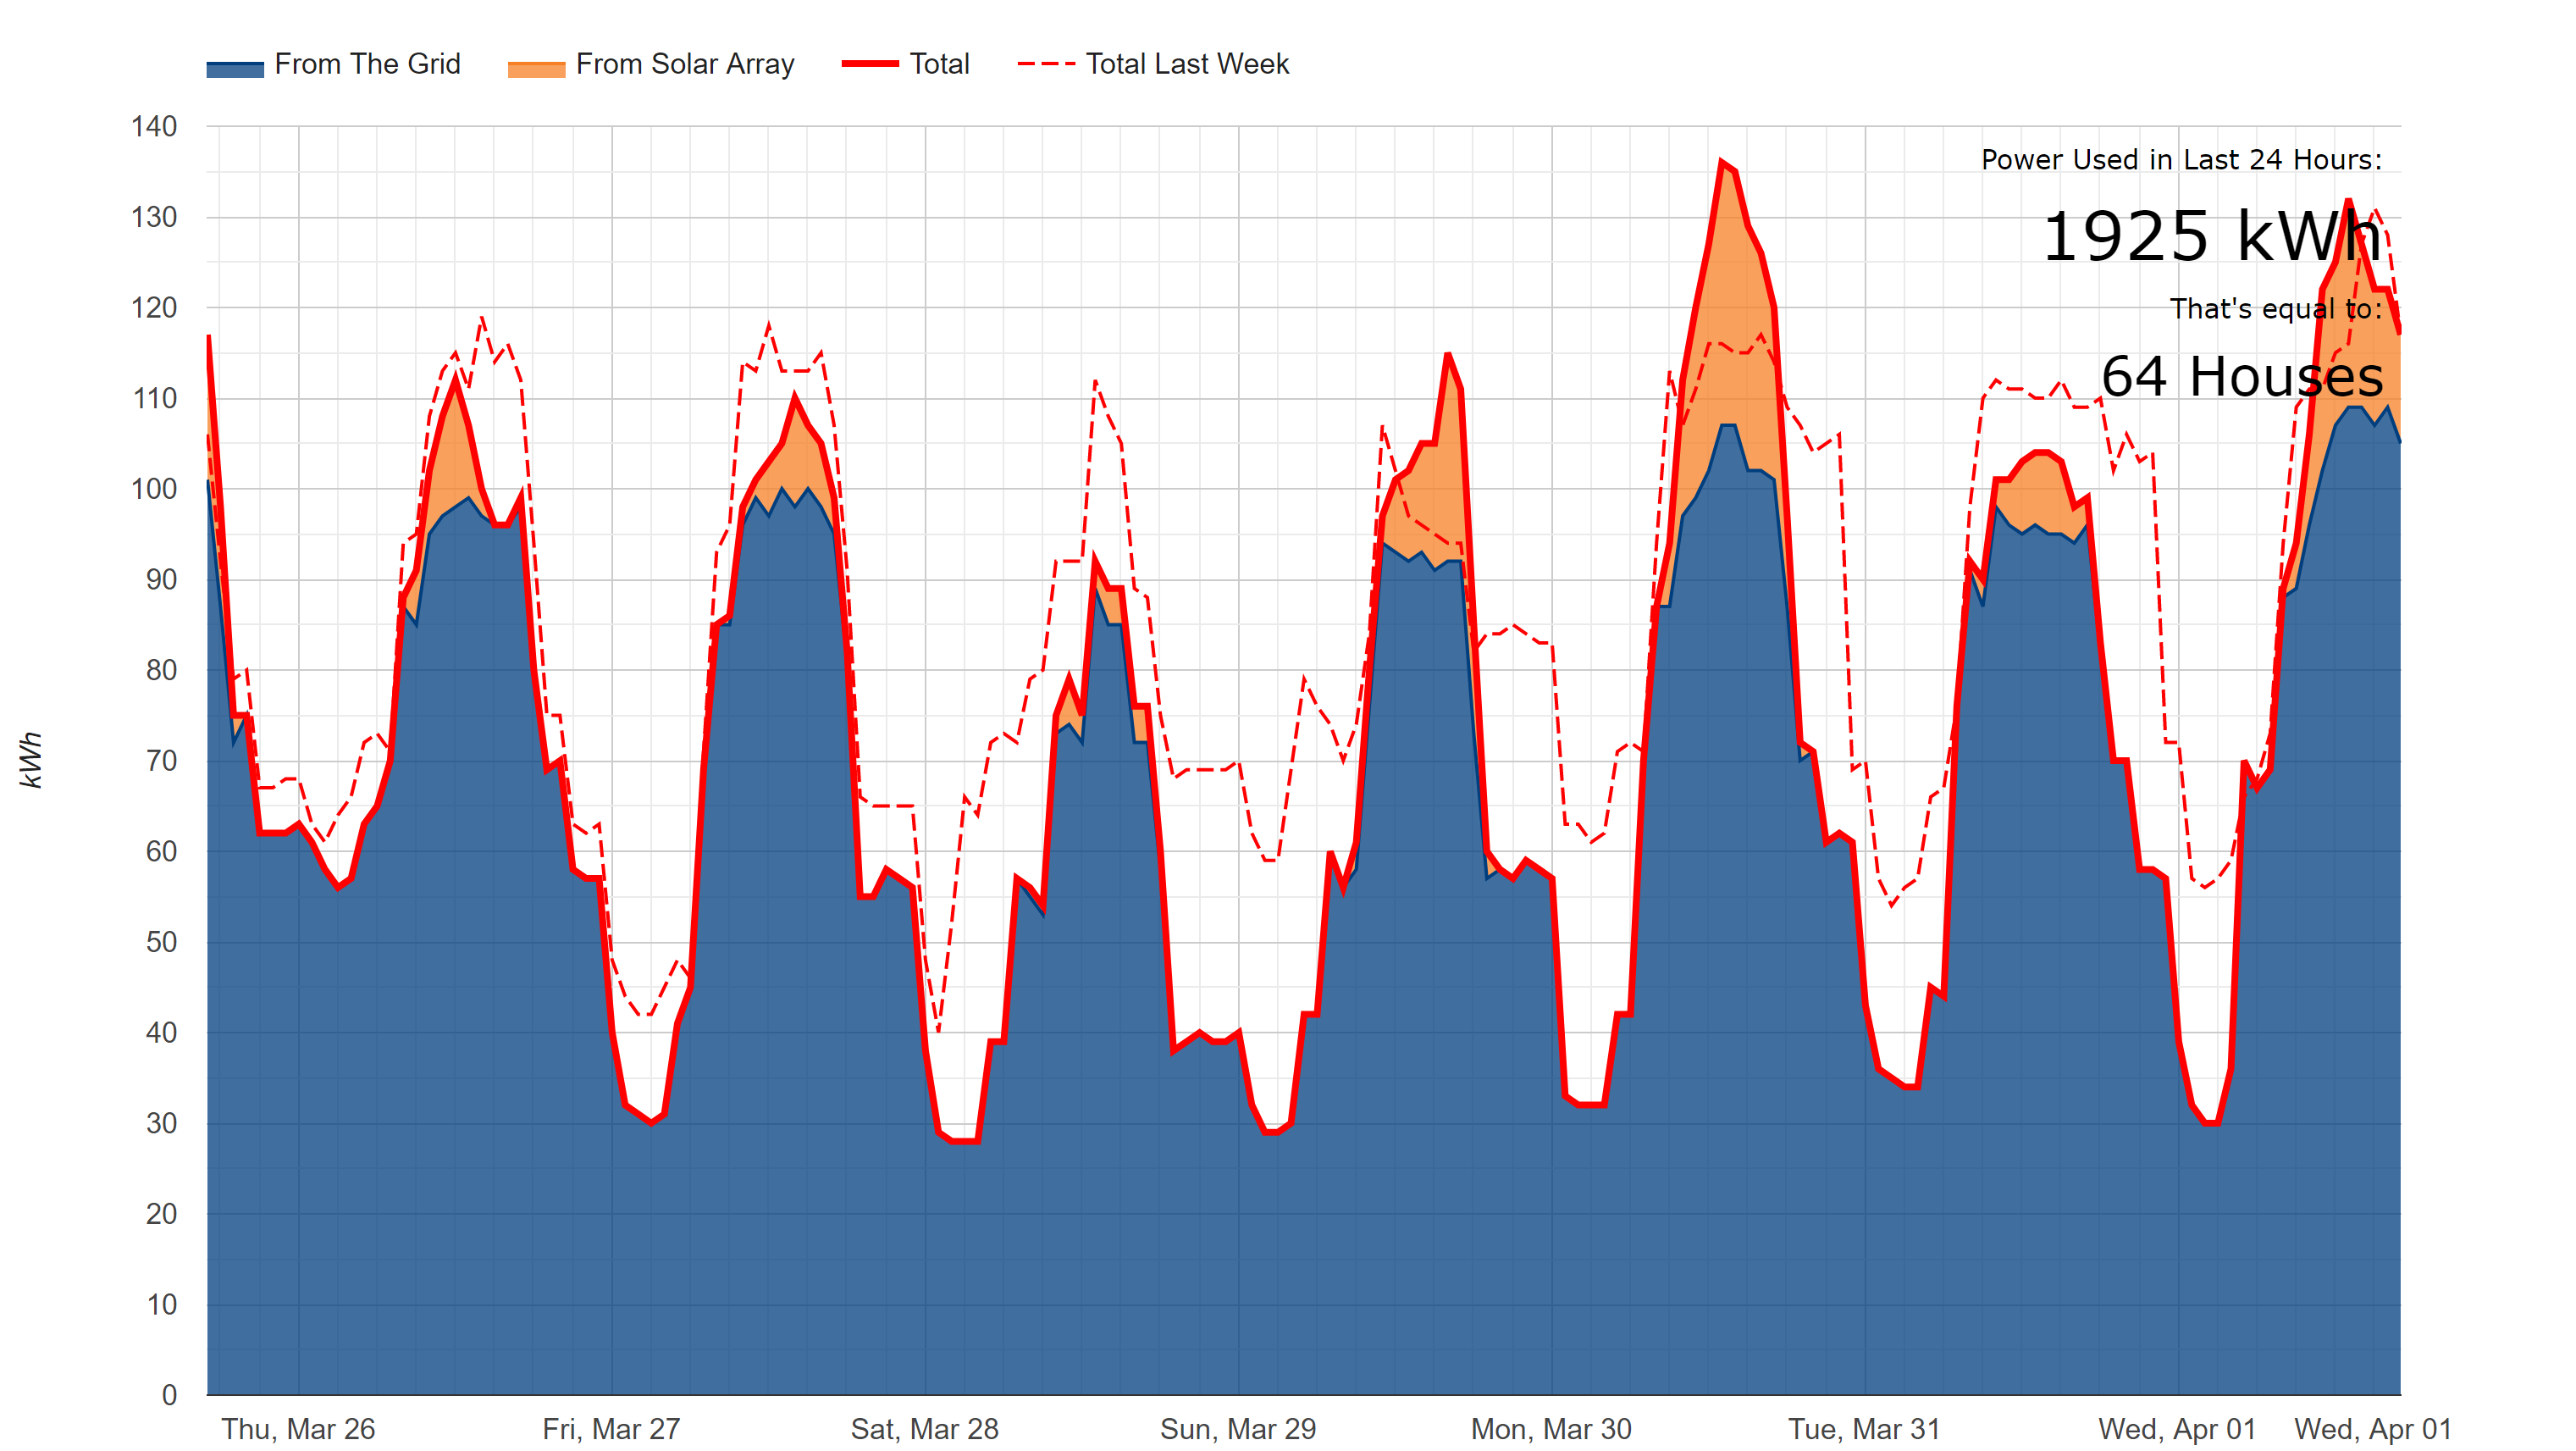
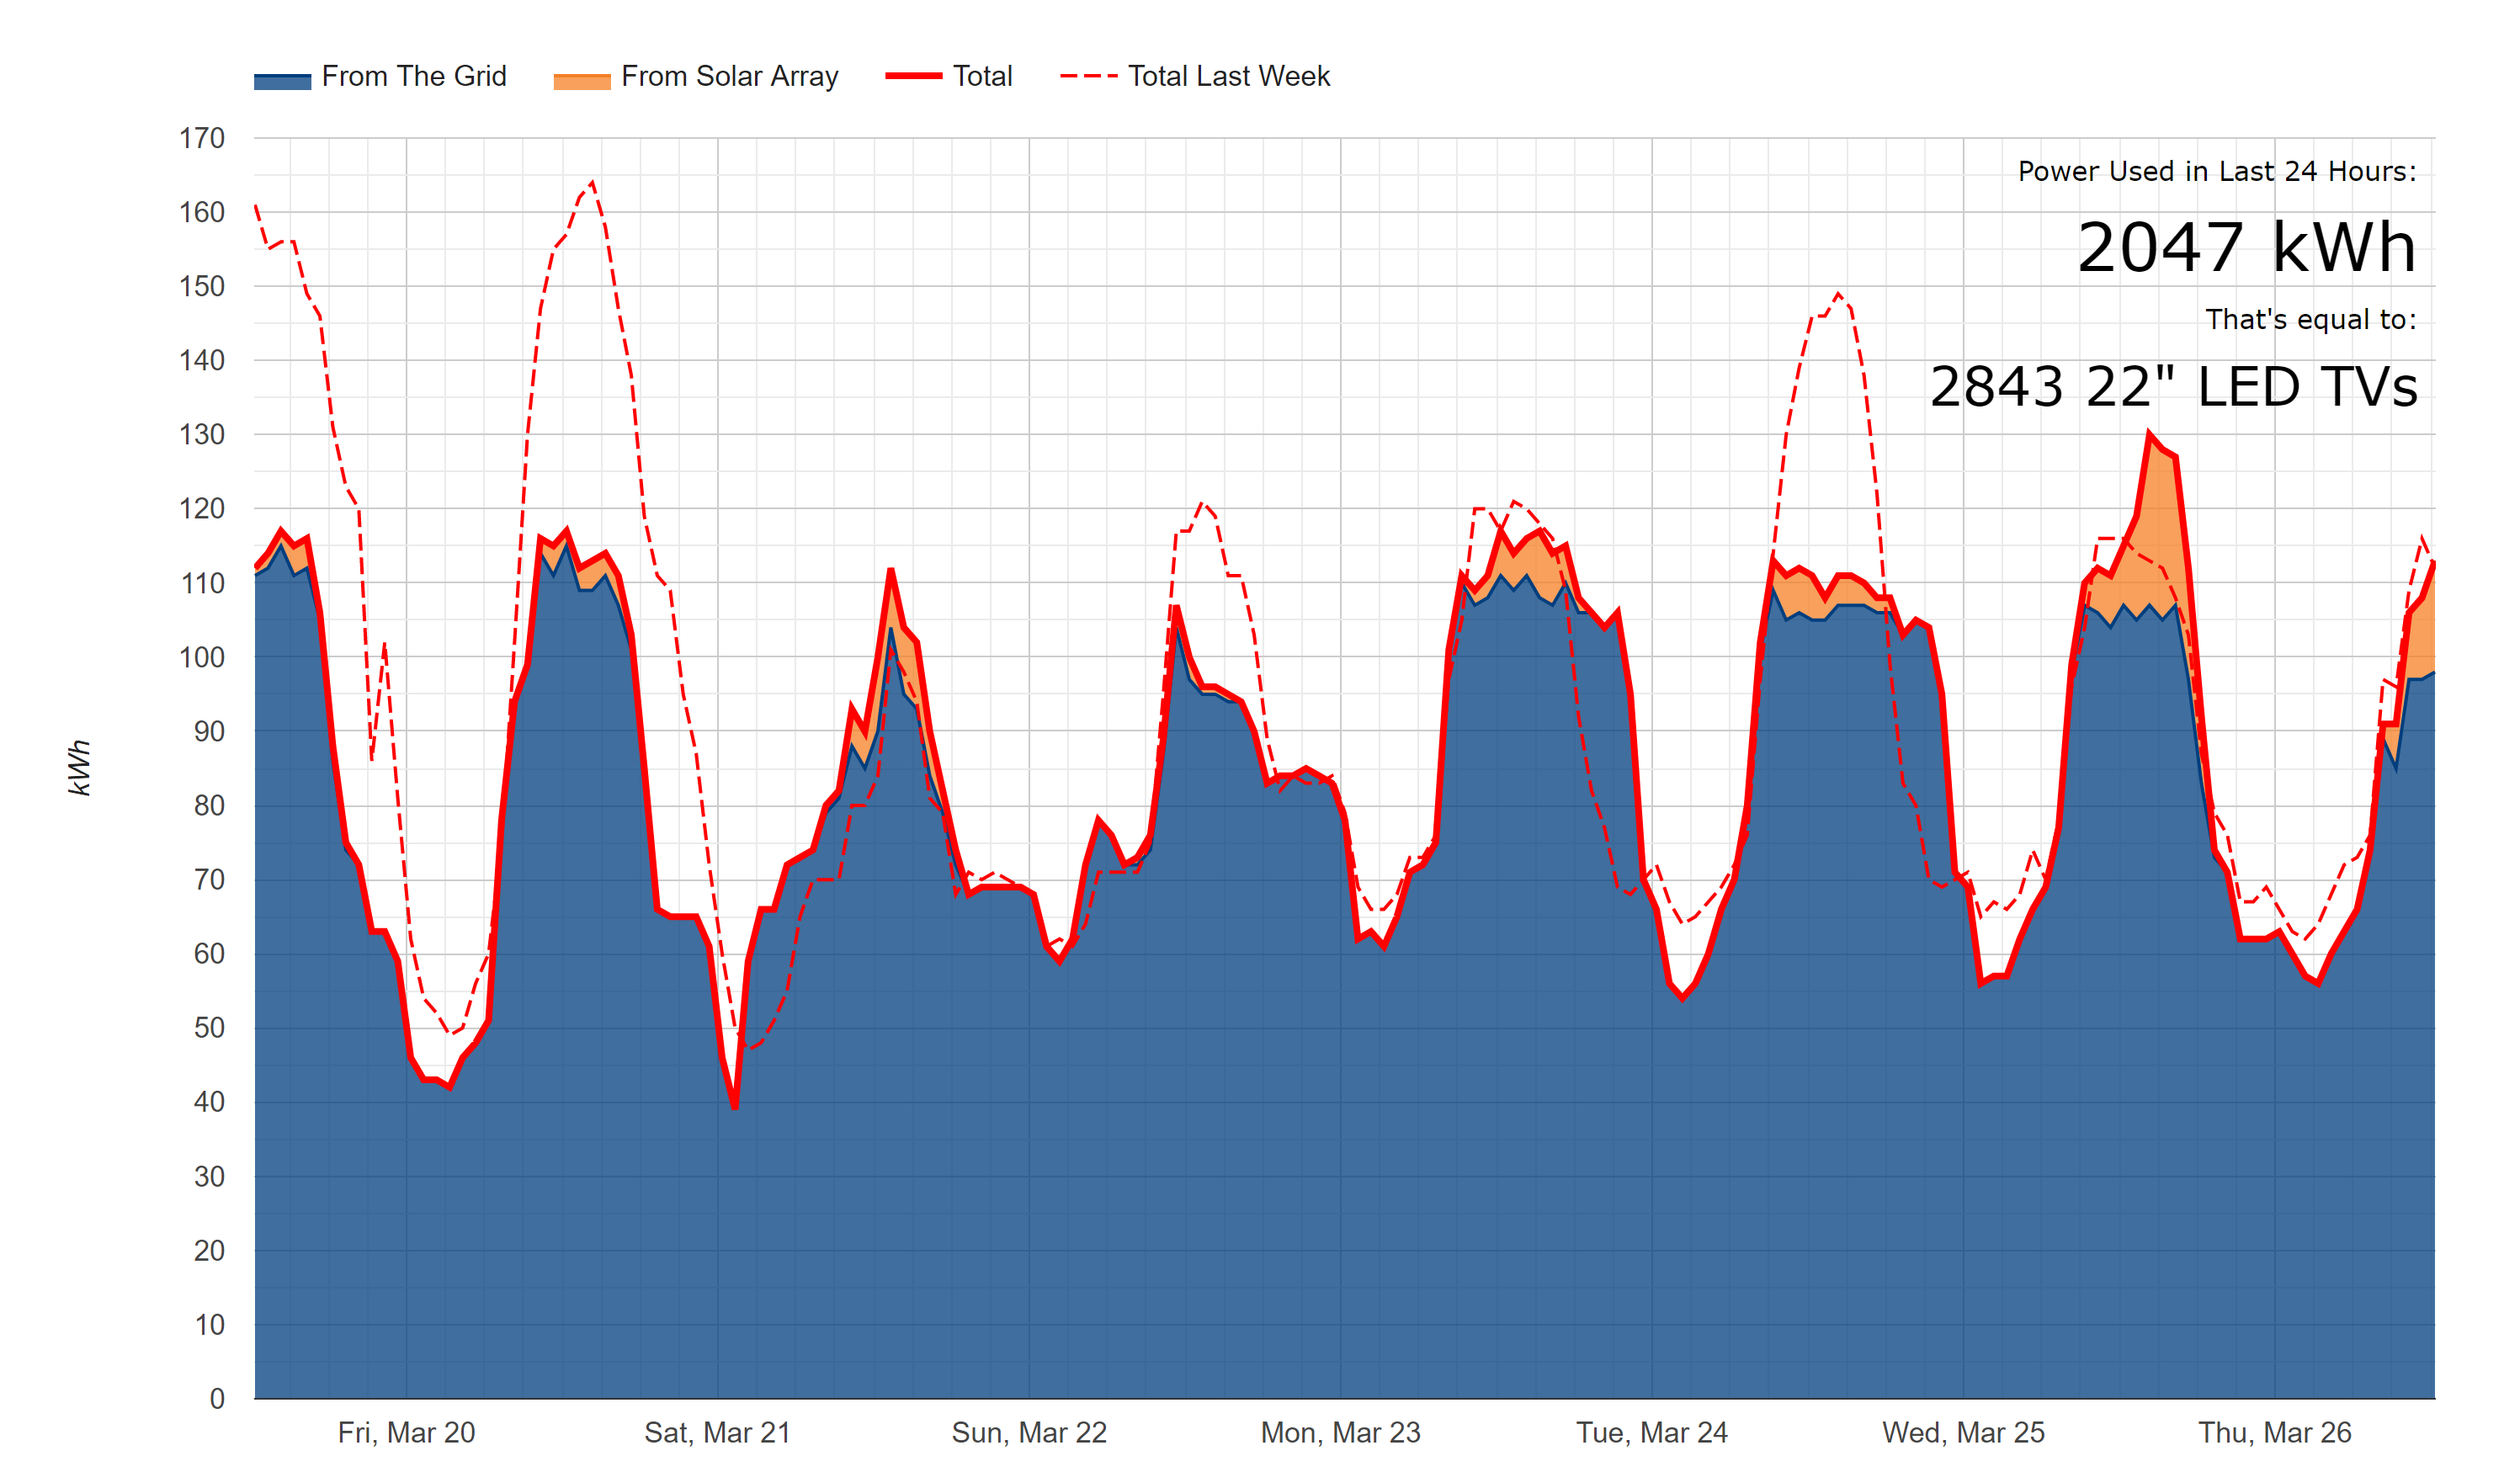
Energy consumption is less this week (Friday, March 20 - Thursday March 26) than last (Thursday, March 12 - Wednesday, March 18). We will continue to monitor energy consumption at BIF as most students and employees are not on campus due to COVID-19 concerns.
The power consumption at the Busines Instructional Facility (BIF) is lower this week, as students leave for spring break, and staff transition to working form home. Stay tuned for additional screen shots as the COVID transition continues.