Veo Total Rides from March 2023 - May 2024
Associated Project(s):
Read the article online at: https://dailyillini.com/news-stories/campus-life/2023/11/14/ui-partnersh.... This article was published on November 14. 2023.
UI updates partnership with Veo Cosmo trial
By , • November 14, 2023
 Anh-Khoi Pham
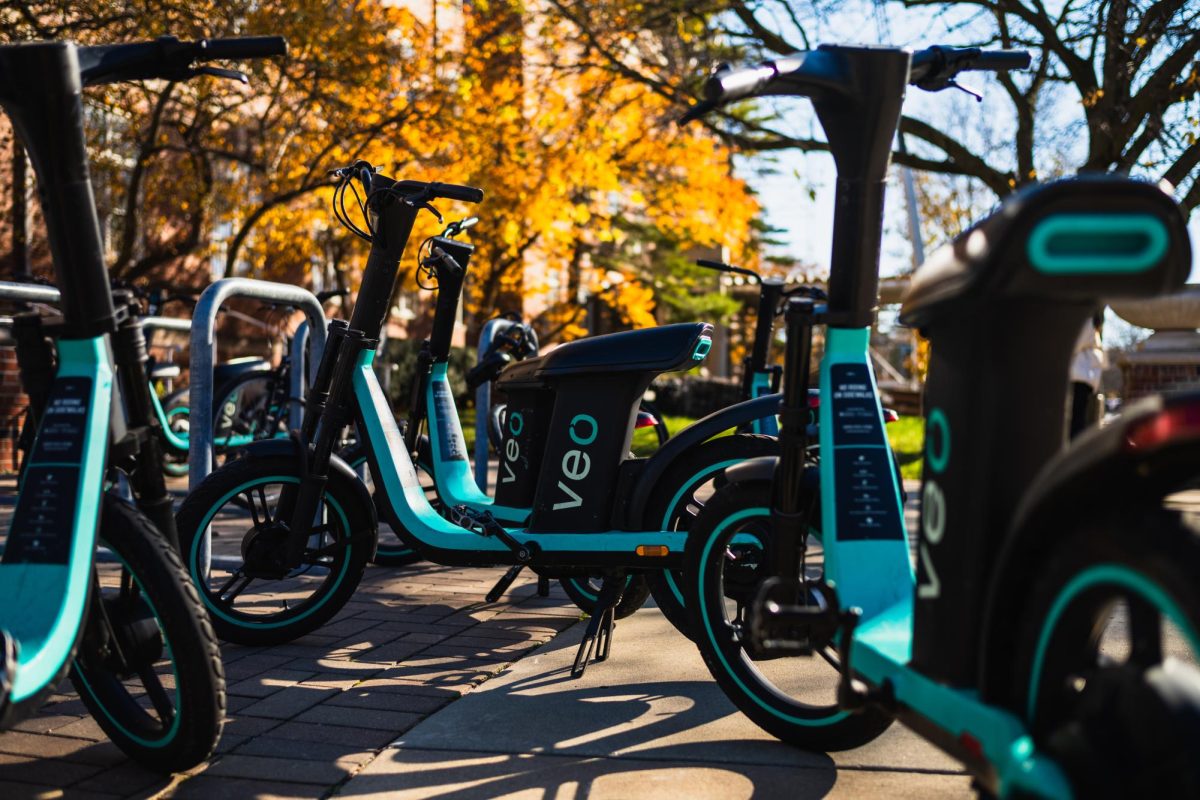
Veo bikes sit in front of Wohlers Hall on Nov. 10.
Anh-Khoi Pham
Veo bikes sit in front of Wohlers Hall on Nov. 10.
After the positive feedback surrounding Veo’s campus pilot program introduced in May, the University will continue its partnership with the transportation service and promote e-bike safety on campus.
The University began its partnership with Veo Micromobility, a bike-share company promoting the availability of clean transportation, in 2019. The partnership allowed students to pay to use bikes and scooters through the Veo app.
Over the summer, stemming from community demand, Veo launched a campus pilot project to introduce motorized class 2 e-bikes. Also known as Cosmo models, these bikes were meant to expand upon the University’s existing rideshare program.
According to an article posted by the bike company Aventon, class 2 e-bikes differ from the previously offered bikes and scooters by providing “assistance when pedaling” and having “a maximum speed of 20 mph with a throttle.”
Sarthak Prasad, sustainable transportation assistant at Facilities & Services, said that the partnership has improved transportation accessibility both on and off campus.
“Veo is providing a service to campus for our students, whether it’s for general use, recreational use or fun,” Prasad said. “For the community outside the University, they have added a value for lower-income families.”
However, Aidan Joyce, sophomore in LAS, said that the pricing of Veo rentals prevents him from using the service more.
“I think that if (Veo) actually lowered the prices, then more people would use the new bikes,” Joyce said.
Since the introduction of the Cosmo e-bikes, Prasad said that minimal safety and vandalism issues have been noticed by the University administration. Despite this, certain questions about e-bike safety for pedestrians on campus have arisen.
“There have been a few minor safety concerns, and we’re working with Veo on those things,” Prasad said. “It’s not just Veo — it’s with the increase in the number of e-bikes and e-scooters that we see on campus.”
Prasad emphasized that the University is currently working on educational campaigns that promote bicycle, e-bike and e-scooter safety, including how to safely ride your bicycle while being aware of your surroundings.
Another issue that has arisen from the introduction of the Cosmo bikes has been the protection of public spaces for non-Veo cyclists.
Geofencing, the GPS technology Veo uses to ensure bikes do not enter specific “no-ride zones,” has also failed to prevent certain inconveniences for typical bikers on campus.
“There are a couple of issues that we have seen with the geofencing restrictions,” Prasad said. “If Cosmo e-bikes are taking up all or a lot of the spaces, then there’s not enough room for people with personal bicycles to park in that area.”
However, despite these minor issues resulting from the introduction of class 2 e-bikes, Prasad said that the response surrounding the campus pilot program was overall favorable.
“There was a community feedback request back at the end of summer, and the response was very positive from the community towards this program,” Prasad said.