RailSplitter Wind Farm provided the June 2025 Buyer's Share amounts by the hour, totaling 1,179.7 Megawatt hours.The June 2025 Buyer's Share Report is attached below.
Morgan White, Quinn Connolly, Steve Bainbridge, Matthew Dalton, Mark Barcus, Joy O'Keefe, and Michael Ward met to discuss Campus practices for geese. The Water Station staff explained their current practices for removing goose eggs from areas with high pedestrian traffic or where geese pose a risk to human health. Other practices such as egg oiling were discussed. No changes to practices will occur at this time, but working with Customer Relations and Communications to create fact sheets or stories was discussed. Many concerns revolved around public perception when intervention is required for geese populations.
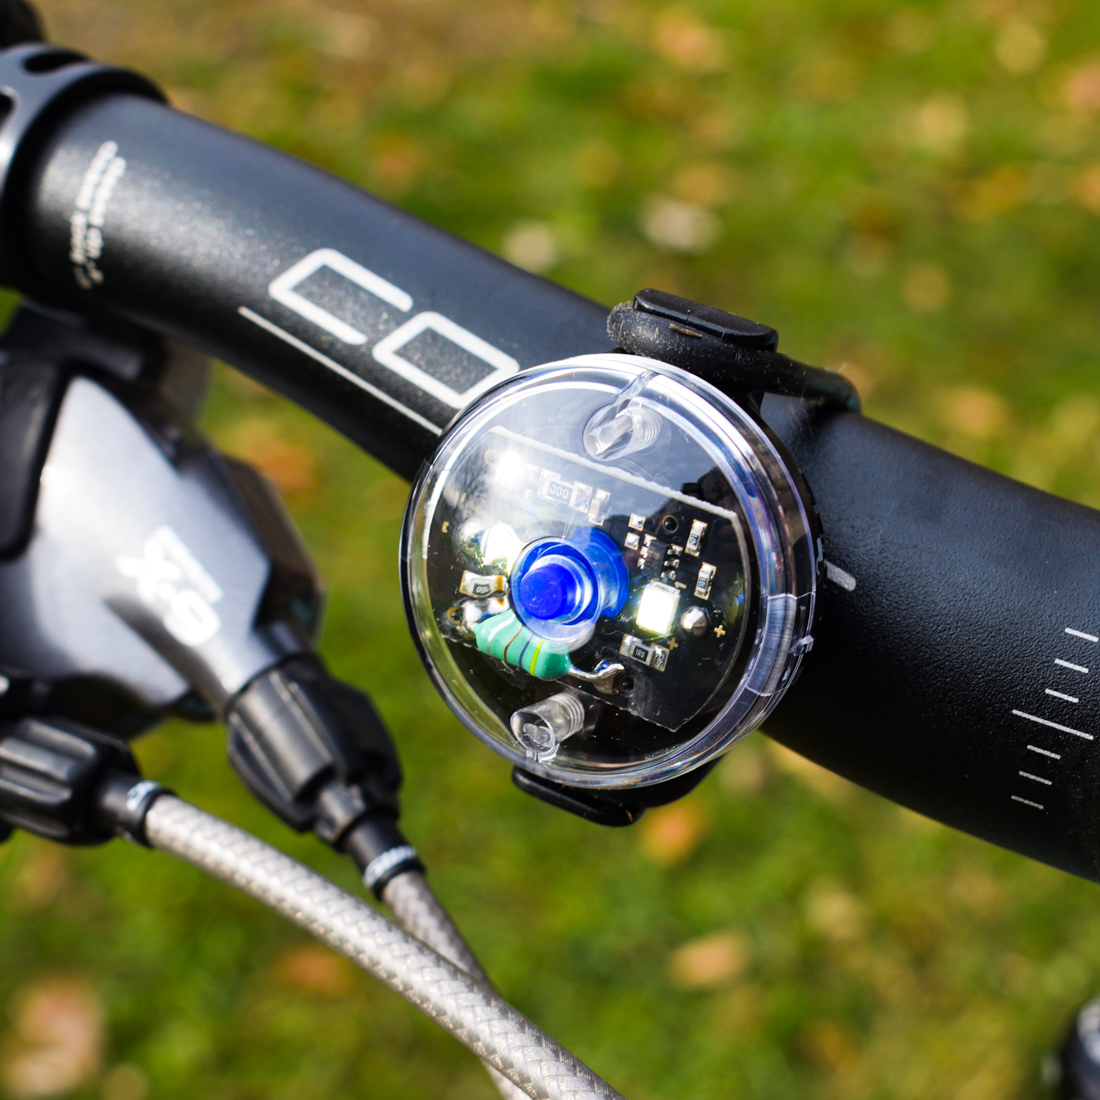
As of this morning, Emily, Max, and Ricardo have finished Phase 2 of the abandoned bicycles project for 2025, identifying abandoned bicycles. 262 bicycles were identified as abandoned and are prepared to be collected by the parking department.
The attached file is a collection of information about thermal energy installations on campus, including solar thermal, geothermal, and biomass. Although it has missing information, it is the start of collecting pertinent information about these systems.
Today, Sarthak and interns Emily and Max have started identifying abandoned bicycles (bicycles with the orange tag not removed) to prepare for the bicycles eventual collection by the Parking Department. This step of the process is expected to be finished later this week.
On June 27th, Emily sent out emails to 14 different organizations that have a bike ambassador, a bike buddy, or a similar program to learn more about bike ambassador and bike buddy programs. The email includes a description of the two goals relating to creating bike ambassador and bike buddy programs stated in the 2024 Campus Bicycle Plan. The email also included a 40 question questionnaire, which is linked as a pdf.
These organizations include the University of Michigan, Michigan State University, the public works department in the county where Pennsylvania State University is located, Rutgers University New-Brunswick, University of Wisconsin-Madison, University of California Irvine, University of Iowa, University of California Los Angeles, University of Edinburgh, University of Maryland, University of Oregon, the City of Madison, Wisconsin, Indiana University, and a local biking group in Portland, Oregon (BikeLoud PDX). While 25 universities were researched, not all universities have a bike ambassador program, a bike buddy program, or a similar program and so local organizations that have such programs in these areas were also contacted. Responses are requested from the 14 organizations by July 25th.
Pretty uneventful week on the whole. Highlight was an 11-year-old coming in with his mom to fix up his beat-up bike. At 11 he had great tool instincts and was excited about getting his hands dirty. Good times!
Our “For Sale” bike numbers are steadily in the low double digits, but next month we’ll focus on building more, in hopes of staying ahead of the crush of returning students.
This evening is the Bike Project member’s meeting, which I will attend.
The numbers:
Visitors: Sales: $970.75 Bikes (refurb): 3 for $590 Memberships: 7 for $210 Tires/tubes: 3 for $20
Emily is working on researching Bicycle Ambassador, Bike Buddy, and Commuter Programs at Big 10 and other universities to eventually implement these programs at UIUC. While the Bicycle Ambassador program was last active around 2014, restarting this program is a priority under the Encouragement area of intervention in the 2024 Campus Bicycle Plan. Similarly, the Bike Buddy program, which would encourage more bicycle trips on campus, especially for newer and less experienced cyclists, is also a priority under the Encouragement area of intervention. Emily is also continuing research on the Commuter program, which is a part of the Evaluation & Planning area of intervention in the 2024 Campus Bicycle Plan.
All, The heat is upon us! The high temps have kept us less busy than we might have otherwise been. Still had some folks in and had a Build-a-Bike completed—which is always especially rewarding. Our new door has been working swimmingly, as folks have been able to enter/exit without wrestling with the door and their bike at the same time.
The numbers:
Visitors: 15 Sales: $525.50 Bikes (refurb): 1 for $200 Bikes (B-a-B): 1 for $50 Tires/tubes: 14 for $93
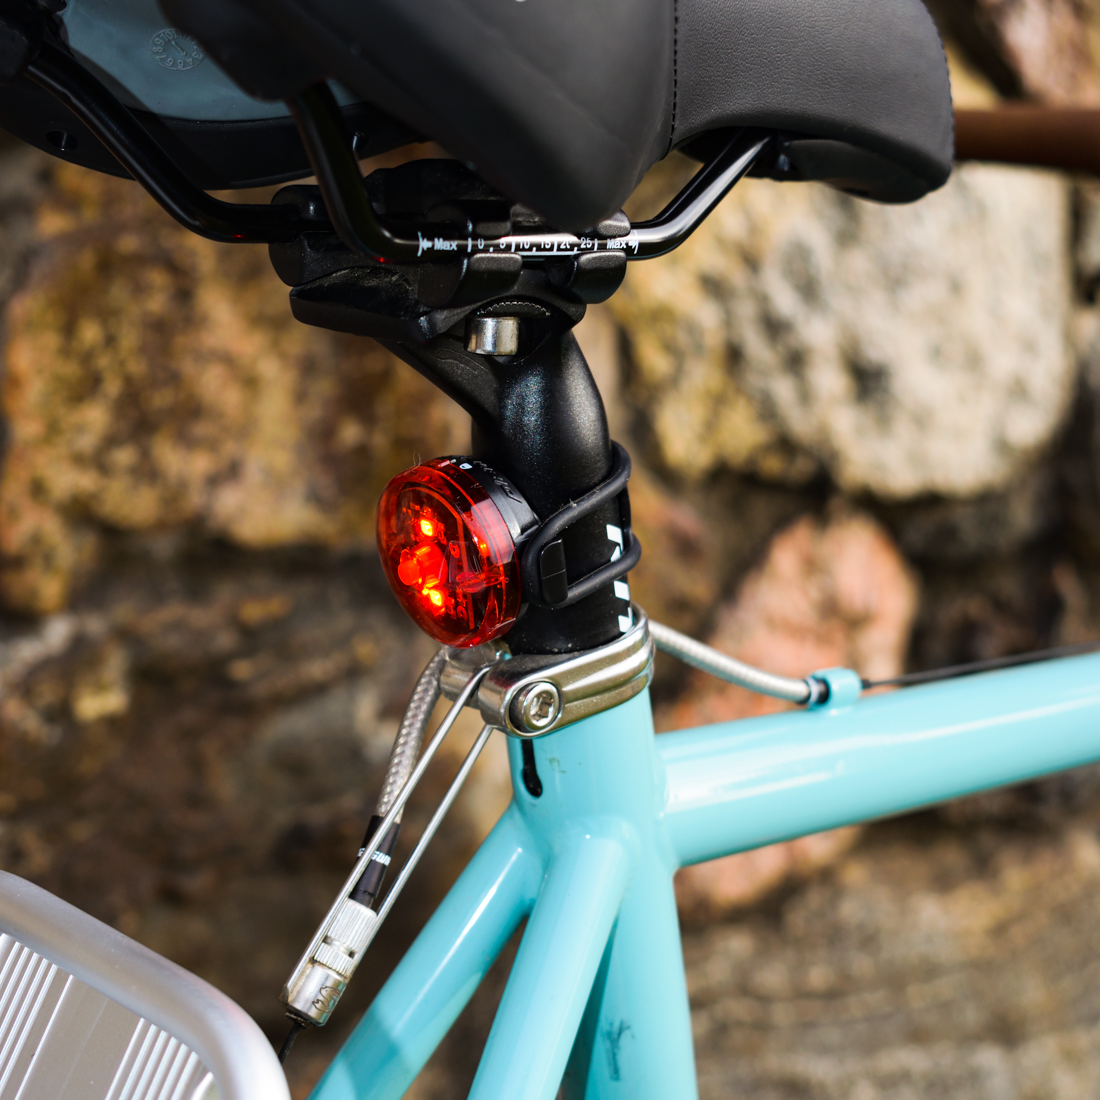
A sales order from Planet Bike was created for 1000 Button Blinky bike lights to be delivered mid-August. Sarthak will reach out for an offical quote on the lights in early July, after the new fiscal year begins. The lights will cost $6.75/set plus shipping.
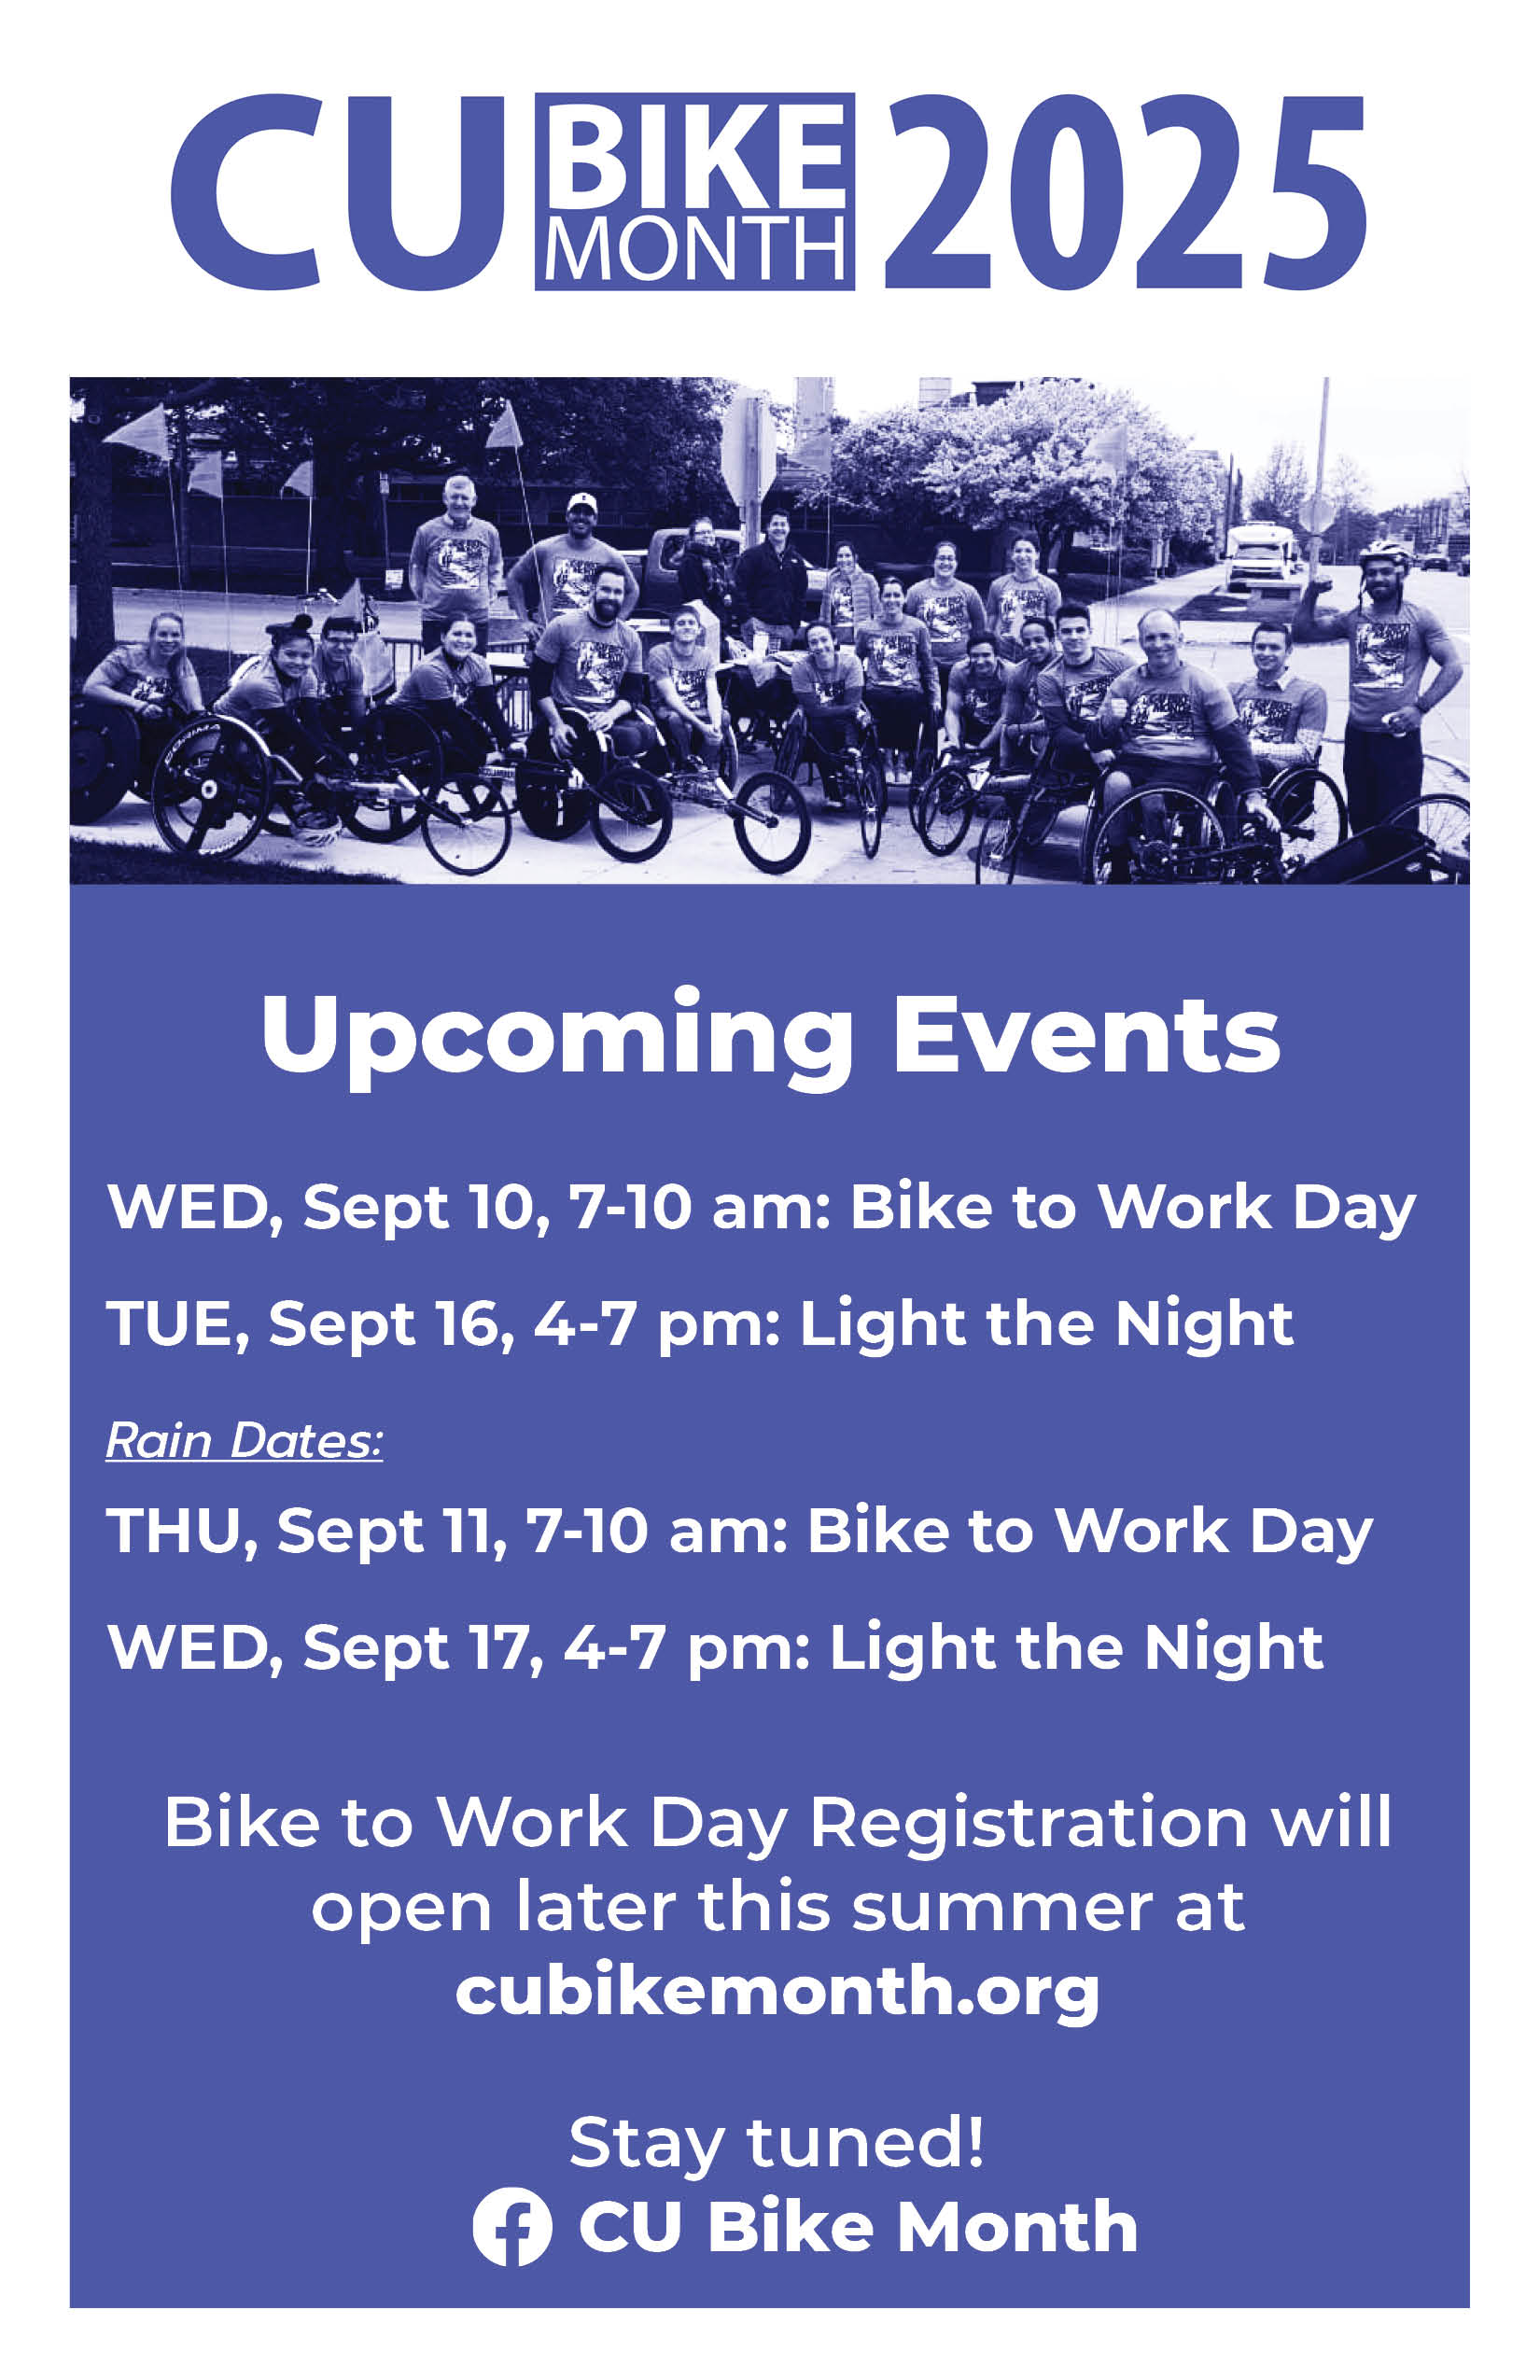
In a meeting on 6/13/2025 dates for the C-U Bike to Work Day and Light the Night events were finalized. Attached is a flyer showing the event dates. Registration will open later this summer at cubikemonth.org.
Wednesday, September 10th, 7-10 am: Bike to Work Day
Tuesday, September 16th, 4-7 pm: Light the Night
Thursday, September 11th, 7-10 am: Bike to Work Day rain date
Wednesday, September 17th, 4-7 pm: Light the Night rain date
I am excited to share the news that the University of Illinois Urbana-Champaign has now been recertified at the Gold ranking in the Sustainability Tracking, Assessment, and Rating System (STARS). This is the sixth time we have received a Gold STARS rating from the Association for the Advancement of Sustainability in Higher Education (AASHE). This achievement represents our ongoing commitment to making sustainable change on campus. The updated 2025 report builds on previous reporting and helps hold us accountable for continuous improvement toward our sustainability goals.
The reporting process required a huge amount of data collection from across different campus units, covering our academic programs, orientation and training programs, energy and emissions, landscape management, transportation systems, administrative policies, and much, much more. I would like to give special thanks to Codie Sterner at SSIB for helping to lead the data collection process, and to our student interns Jenna Schaefer and Lucy Zhou for their invaluable contributions.
If you are receiving this email, it is because you helped provide key data and insights during this process. We sincerely appreciate your efforts and contributions to our campus sustainability efforts – completing this report and achieving this result would not have been possible without you!
Best,
Miriam
Miriam Keep Sustainability Programs Coordinator
Institute for Sustainability, Energy, and Environment (iSEE)